

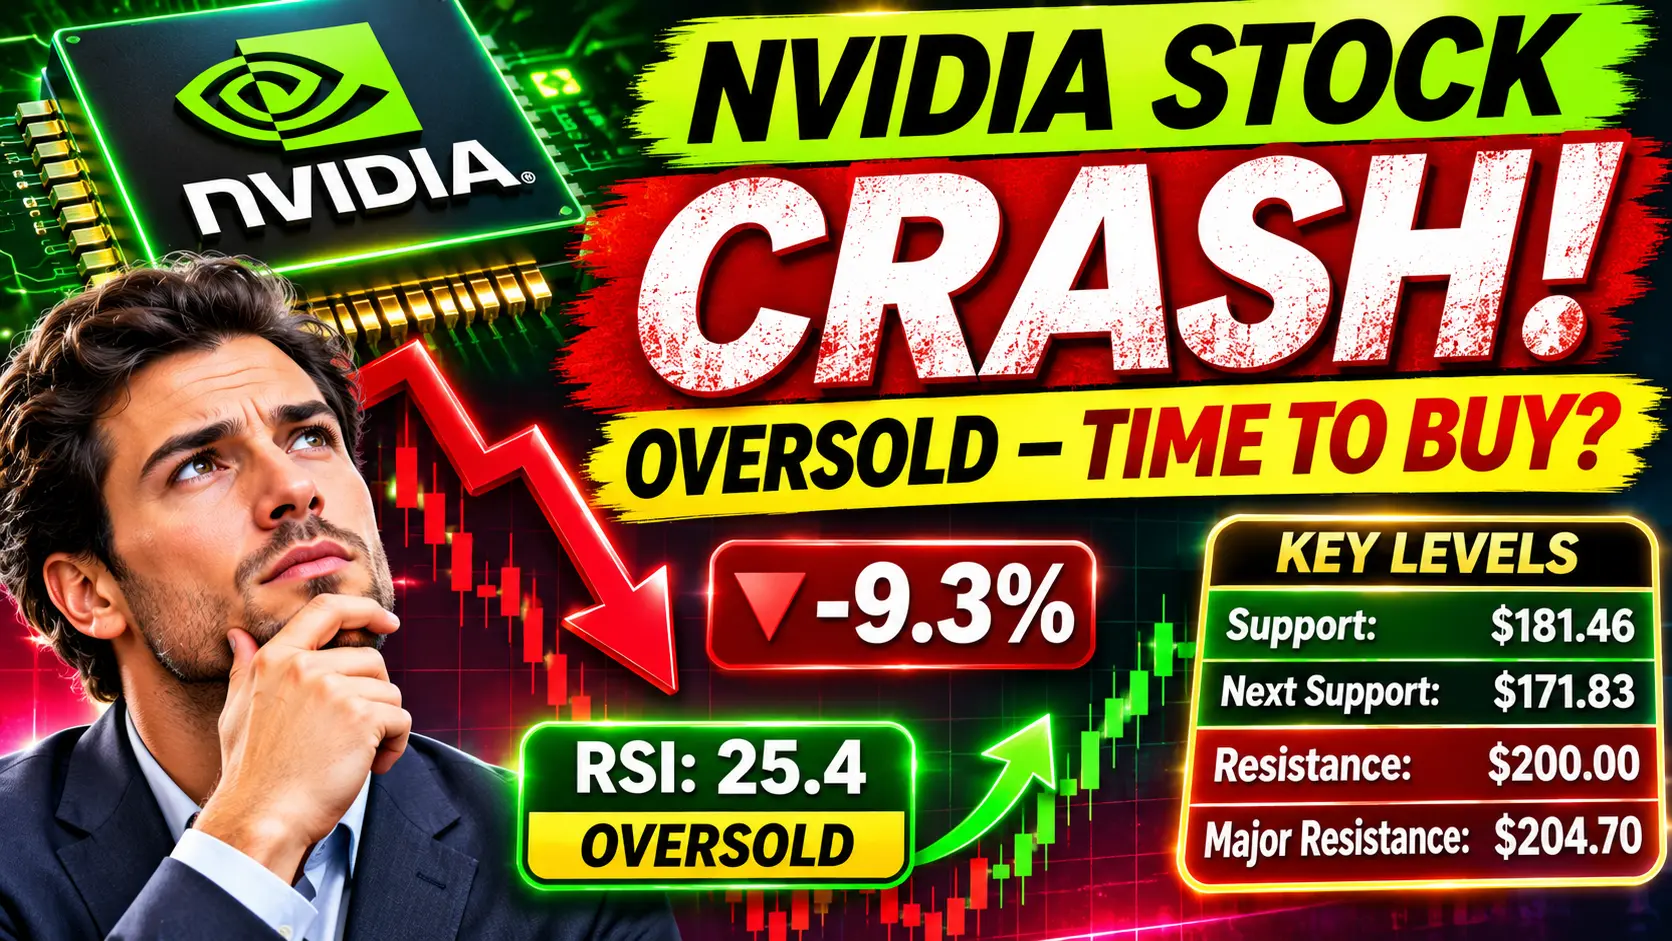
NVIDIA Stock Analysis: 📉 NVIDIA Stock News (November 6, 2026): NVIDIA Corporation (NASDAQ: NVDA) is attracting renewed investor attention after its shares plunged 9.3% on Thursday, November 5, before staging a significant recovery during Friday’s early trading session. The sharp decline pushed several technical indicators into oversold territory, raising questions about whether the world’s leading AI chipmaker could be approaching a potential recovery.
NVIDIA shares closed Thursday at $181.60 after touching an intraday low of $181.46. However, the stock rebounded to approximately $193.09, representing a gain of 6.33%, in the early US trading snapshot reported on November 6 at 9:33 AM EST.
Investors are now watching important technical levels, including $200, $204.70 and $209, to determine whether this recovery could develop into a sustained upward movement.
But is NVIDIA stock genuinely ready for a comeback, or is the latest rebound simply a temporary relief rally?
📊 1. NVIDIA Stock Price Today: Shares Rebound After a 9.3% Decline
NVIDIA experienced one of its most significant single-session declines since January 2025 when its shares dropped 9.3% on November 5.
The stock fell from its previous closing price of approximately $200.13 to $181.60. During the session, sellers pushed the price as low as $181.46.
The selling pressure was not limited to NVIDIA. Other semiconductor and artificial intelligence-related companies also experienced substantial declines.
However, Friday’s trading brought some relief. NVIDIA recovered to approximately $193.09 in the early-session snapshot, supported by renewed buying interest across technology stocks.
The recovery suggests that some investors may be attempting to purchase shares following the sharp decline.
Nevertheless, one positive trading session does not confirm that the broader downward trend has ended.
🤖 2. Why Did NVIDIA Stock Fall So Sharply?
The latest NVIDIA sell-off was part of a broader technology-sector correction rather than an isolated company-specific event.
Concerns surrounding the US midterm election results increased uncertainty about potential artificial intelligence regulations and the expansion of large data centres.
Data centres are essential to AI development because they require powerful processors, networking equipment and substantial electricity infrastructure.
Investors are concerned that additional regulations or restrictions could slow infrastructure development and affect the future growth expectations of semiconductor companies.
The broader technology sell-off also affected competitors.
AMD shares reportedly declined approximately 17%, while some memory-related companies experienced losses ranging from 16% to 22%.
The Nasdaq 100 fell approximately 6.4%, while the Philadelphia Semiconductor Index dropped around 12% during the reported market decline.
This broader weakness demonstrates how closely NVIDIA’s valuation is connected to investor confidence in the overall AI industry.
📉 3. Is NVIDIA Stock Oversold? Understanding the RSI Indicator
One of the most important technical developments is NVIDIA’s Relative Strength Index (RSI).
The RSI measures the speed and magnitude of recent price movements. It generally ranges between 0 and 100.
Traders commonly interpret RSI readings below 30 as oversold and readings above 70 as overbought.
According to the November 6 technical analysis:
- Daily RSI reached approximately 25.4 during Thursday’s decline.
- The RSI subsequently recovered to approximately 36.6 in the early Friday snapshot.
- The Stochastic indicator also remained in oversold territory.
These readings suggest that NVIDIA experienced substantial selling pressure.
However, an oversold RSI does not guarantee an immediate recovery.
Stocks can remain oversold for extended periods during strong downward trends. Investors should therefore look for additional confirmation through price action, trading volume and moving averages.
The improvement in RSI is encouraging, but the broader technical structure still requires attention.
📈 4. NVIDIA Moving Averages: Important Levels Investors Should Watch
Moving averages help traders understand the broader direction of a stock’s price.
NVIDIA was trading below several important daily moving averages following Thursday’s decline.
The reported technical levels were:
| Technical indicator | Price level |
|---|---|
| 20-day EMA | $209.36 |
| 50-day SMA | $219.93 |
| 200-day SMA | $204.70 |
| Weekly 50-day SMA | $200.25 |
| Weekly 100-day SMA | $174.84 |
The 200-day moving average is particularly important because long-term investors frequently monitor it to assess the broader market trend.
NVIDIA’s decline below approximately $204.70 represents a significant technical development.
For the recovery to become more convincing, the stock would need to regain important moving-average levels and maintain support above them.
The $204.70 region is therefore an important level to monitor.
🎯 5. NVIDIA Stock Support and Resistance Levels
Support and resistance levels help investors identify areas where buying or selling pressure may increase.
Following the sharp decline, several important price zones have emerged.
Important resistance levels
$193–$194: This is the immediate recovery area and a reported gap-fill zone.
$200: The previous November 4 closing area represents another important hurdle.
$204.70: NVIDIA’s broken 200-day simple moving average is a major technical resistance level.
$209: The 20-day exponential moving average represents another potential obstacle.
$219–$220: This area corresponds approximately to the 50-day simple moving average.
Important support levels
$181.46: This is the intraday low recorded on November 5 and an important near-term support reference.
$171.83: This is a reported daily S2 pivot support level.
$164.27: This represents the reported 52-week low.
$162.10: This is another reported daily pivot reference, although it is below the cited 52-week low.
These levels are technical reference points, not guaranteed turning points.
🟢 6. Bullish Scenario: Can NVIDIA Recover Above $200?
The bullish scenario depends on whether NVIDIA can maintain its recovery and regain important resistance levels.
A sustained move above the $193–$194 area would be an encouraging first development.
If buyers can push the stock above $200, attention may shift towards the $204.70 region.
Regaining the 200-day moving average would strengthen the technical recovery argument.
However, traders would still need confirmation through stronger price action and healthier trading volume.
A sustained recovery above these levels would suggest that the recent selling pressure may be weakening.
🔴 7. Bearish Scenario: What If NVIDIA Falls Below $181.46?
The bearish scenario remains relevant because the stock was still trading below its important daily moving averages in the reported technical analysis.
If the recovery fails around $193–$200 and selling pressure returns, investors will closely monitor the November 5 low of $181.46.
A decisive break below this level could indicate renewed weakness.
The next reported technical reference is the $171.83 pivot level, followed by the broader downside reference zones around $164 and $162.
A renewed decline could also reflect continuing uncertainty about AI infrastructure spending and semiconductor-sector valuations.
Investors should therefore avoid assuming that the first rebound after a major decline represents a confirmed market bottom.
💡 8. Should Investors Buy NVIDIA Stock After the 9% Drop?
NVIDIA remains an important company in the artificial intelligence and semiconductor industries. Its products play a significant role in advanced computing, AI infrastructure and data centres.
However, a sharp price decline alone does not automatically make a stock attractive.
Before considering an investment, investors should evaluate:
- Business performance: Examine revenue growth, earnings and future guidance.
- AI demand: Assess whether demand for AI chips remains sustainable.
- Valuation: Compare the stock’s valuation with its earnings and growth expectations.
- Technical recovery: Watch whether NVIDIA can reclaim important resistance levels.
- Risk management: Consider position sizing and the possibility of further declines.
Long-term investors and short-term traders may interpret the same technical signals differently.
A long-term investment decision should not depend exclusively on one RSI reading or a single trading session.
🔮 9. NVIDIA Stock Outlook: What Happens Next?
NVIDIA’s immediate outlook depends on whether the latest recovery can develop into a stronger upward trend.
The stock’s improvement from $181.60 to approximately $193.09 shows that buyers returned after the sharp decline.
However, several technical obstacles remain.
The $200 level, followed by the $204.70 200-day moving average, will be particularly important for assessing recovery strength.
On the downside, $181.46 remains a crucial reference level.
Investors should also monitor developments involving AI regulation, data centre construction, semiconductor demand and upcoming company financial results.
Final verdict: NVIDIA is showing signs of a short-term rebound after an unusually sharp sell-off, while its oversold technical readings suggest that selling pressure had become extreme. However, the broader technical picture remains cautious until important resistance levels are reclaimed.
For investors, patience and risk management may be more valuable than trying to predict the exact market bottom.
❓ Frequently Asked Questions About NVIDIA Stock
1. Why did NVIDIA stock drop 9.3% on November 5, 2026?
NVIDIA shares declined amid a broader technology-sector sell-off. Concerns about AI regulation, data centre expansion and uncertainty surrounding future AI infrastructure investments contributed to investor anxiety.
2. Is NVIDIA stock oversold after the 9% decline?
Yes. NVIDIA’s daily RSI dropped to approximately 25.4 during Thursday’s sell-off, below the commonly watched 30 oversold threshold. However, an oversold reading does not guarantee a price recovery.
3. What is NVIDIA’s most important support level?
The November 5 intraday low of $181.46 is an important immediate support reference. Additional reported downside levels include $171.83 and the 52-week low near $164.27.
4. What are the major resistance levels for NVDA stock?
The important resistance areas are approximately $193–$194, $200, $204.70, $209 and $219–$220. These levels may influence the strength of a potential recovery.
5. Is NVIDIA stock a buy after the recent crash?
A sharp decline can create opportunities, but it also carries risks. Investors should evaluate NVIDIA’s business fundamentals, valuation, AI demand, technical indicators and personal risk tolerance before making an investment decision.
Financial disclaimer: This article is for educational and informational purposes only. It is not investment advice or a recommendation to buy or sell NVIDIA shares. Stock prices are volatile, technical levels can change, and investors may lose capital. Always conduct independent research or consult a qualified financial adviser before investing.